Operating income
Operating income stood at € 7.8 million, up 41% year on year. Two factors helped to place the result at this level: 7% more revenue from fees represents almost € 11 million euros of the nearly € 14 million difference compared to 2016; and the remaining 3 million are the result of the losses of fixed assets the previous year, the most important of which was the loss of the painting ship.
Other expenditure items remained stable or increased slightly, such as staff (+2%), and others decreased, such as the € 1 million in operating expenses.
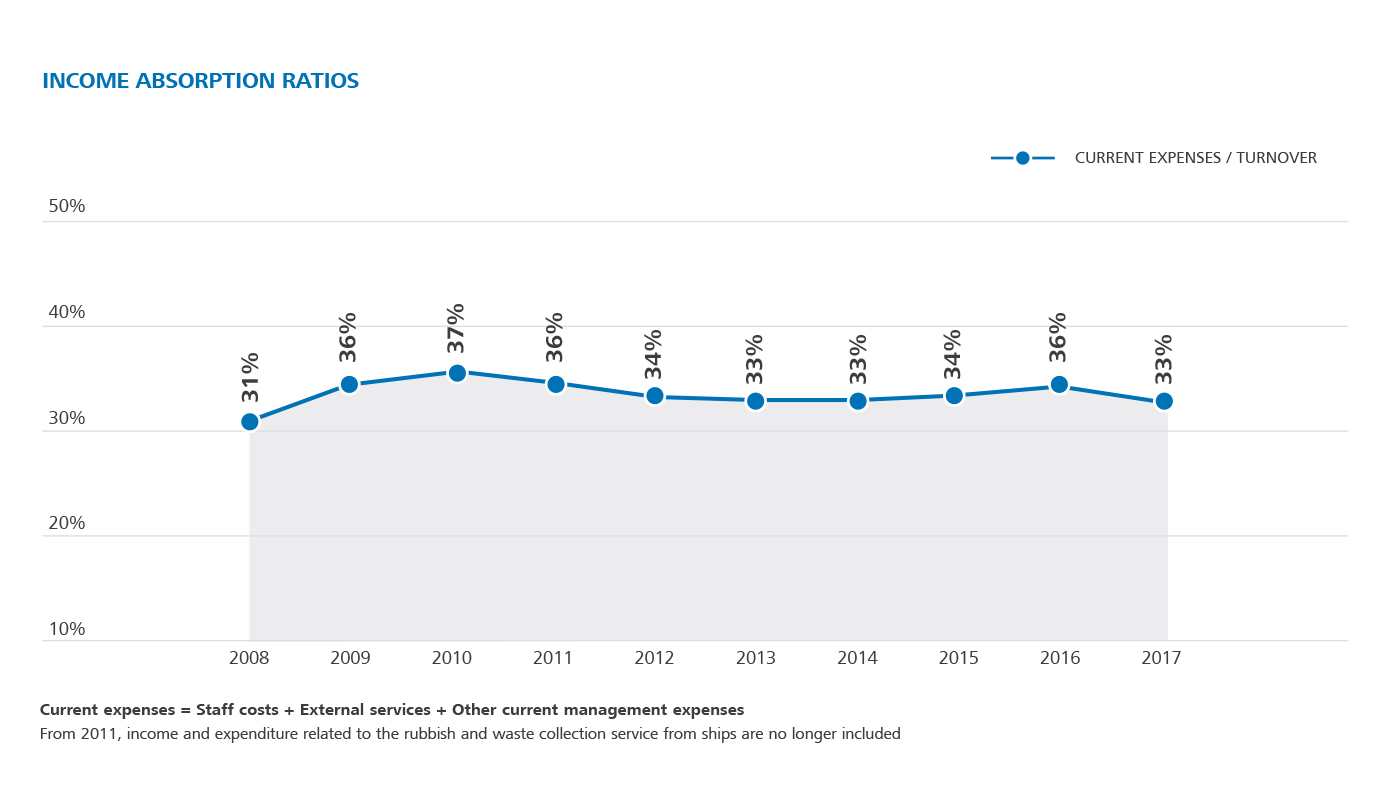
In the analysis of the absorption ratio of expenses, we can see that the aforementioned factors - one million less cargo and an 11 increase in turnover - have pushed up efficiency and put the ratio at one of its best figures in the last ten years.
Operating profit (thousand EUR)
| 2017 | 2016 | Variation | %Var. | |
|---|---|---|---|---|
| Net turnover | 166,346 | 155,474 | 10,872 | 7% |
| Other operating income | 4,630 | 5,389 | (759) | -14% |
| Staff costs | (31,646) | (30,890) | (756) | 2% |
| Other operating expenses | (42,769) | (43,923) | 1,154 | -3% |
| Depreciations of fixed assets | (55,398) | (55,720) | 322 | -1% |
| Allocation of grants and other non-financial assets | 6,743 | 6,900 | (157) | -2% |
| Surplus provisions | 120 | - | 120 | - |
| Impairment and gains on disposals of assets | (16) | (3,344) | 3,328 | -100% |
| Other results | (234) | - | (234) | - |
| Total | 47,776 | 33,886 | 13,890 | 41% |