ECONOMIC AND FINANCIAL REPORT
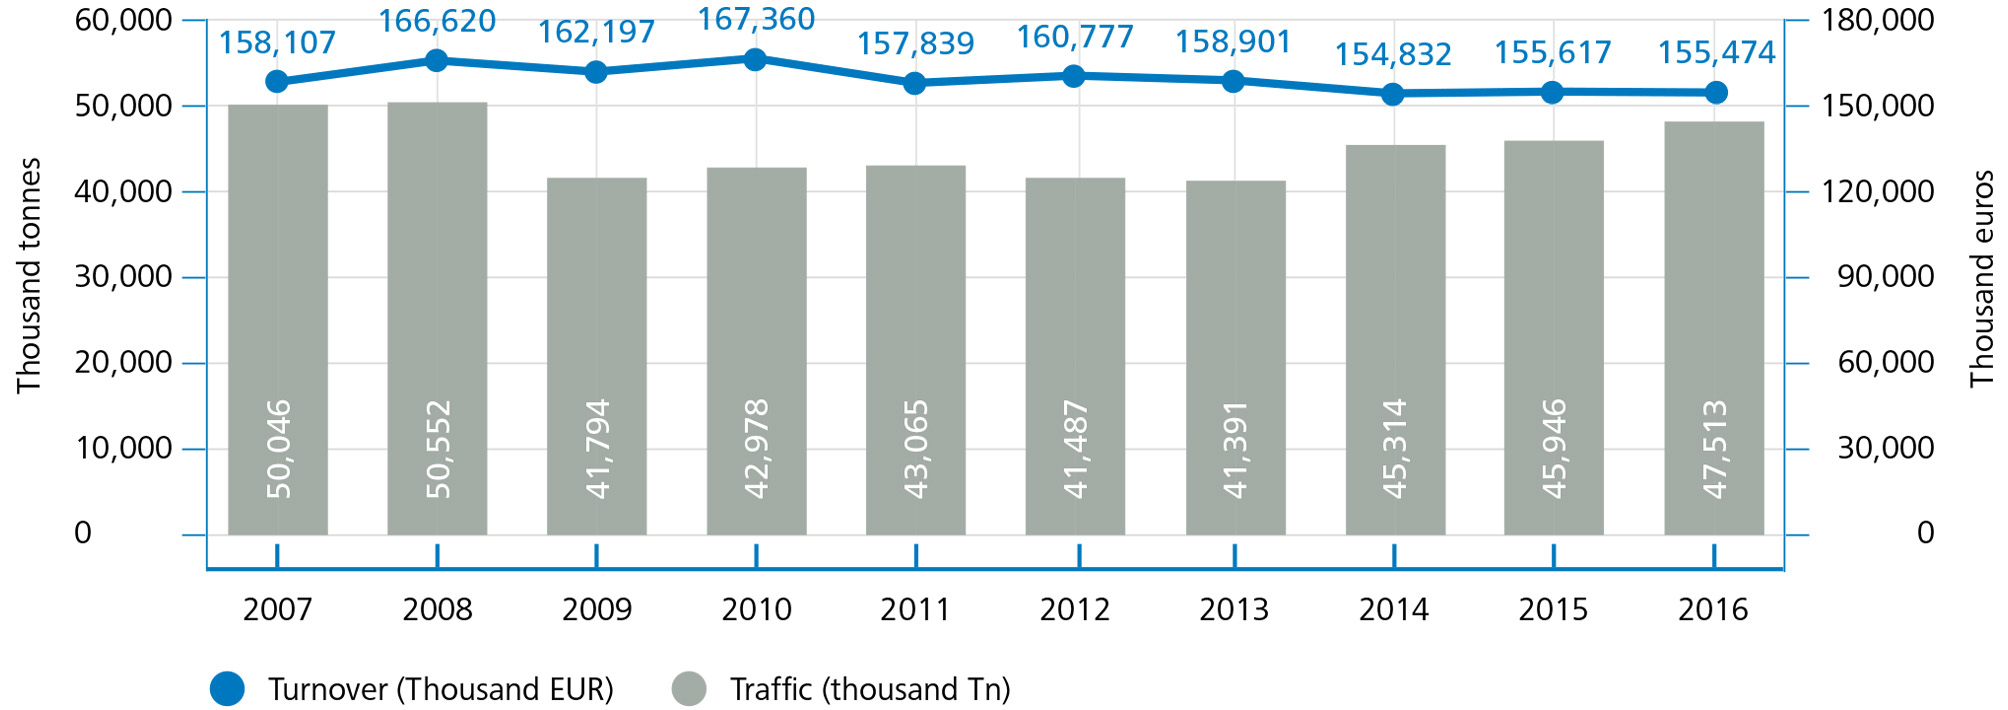
Net turnover in 2016 totalled € 155.5 million and was the same as the previous year
PROFIT FOR THE YEAR (Million EUR)
| 2016 | 2015 | Variation | % Var. | |
|---|---|---|---|---|
| Operating profit | 33.9 | 36.9 | (3,0) | -8% |
| Financial results | (0.5) | 2.5 | (3.0) | - |
| Tax on profits | - | - | - | - |
| Total | 33.4 | 39.4 | (6.0) | -15% |
We closed financial year 2016 with net profits of € 33.4 million, 15% lower than the previous year. The decrease in profit was driven mainly by the extraordinary gains obtained in 2015 on the divestment of financial assets.
Total income from port fees decreased slightly due to lower revenues in the occupation fee, driven by the new valuation of Port of Barcelona land. However, the increase in revenue from vessel and cargo fees offset this fall in revenue from concessions in the public domain.
Total freight traffic increased by 3.4% year on year to 47.5 million tonnes. The most strategic traffics again recorded significant annual growth: containers, which totalled 2.2 million TEU, increased by 14.5%; cars, up 4%, and total passengers, up 7%.
1/10
NET TURNOVER (ACCORDING TO INCOME STATEMENT) (Thousand EUR)
| 2016 | 2015 | Variation | % Var. | |
|---|---|---|---|---|
| Port fees | 142,498 | 143,593 | (1,095) | -1% |
| Occupation fees | 52,439 | 55,445 | (3,006) | -5% |
| Fees for use | 74,520 | 72,427 | 2,093 | 3% |
| Vessel fees | 27,269 | 26,780 | 489 | 2% |
| Fees for pleasure craft | 441 | 390 | 51 | 13% |
| Passenger fees | 9,856 | 9,728 | 128 | 1% |
| Cargo fees | 36,565 | 35,180 | 1,385 | 4% |
| Fresh fish fees | 180 | 190 | (10) | -5% |
| Fees for special use of the transit area | 209 | 159 | 50 | 31% |
| Activity fees | 14,214 | 14,311 | (97) | -1% |
| Navigation aids fees | 1,325 | 1,410 | (85) | -6% |
| Other business income | 12,976 | 12,024 | 952 | 8% |
| Income from additional items | 5,683 | 5,043 | 640 | 13% |
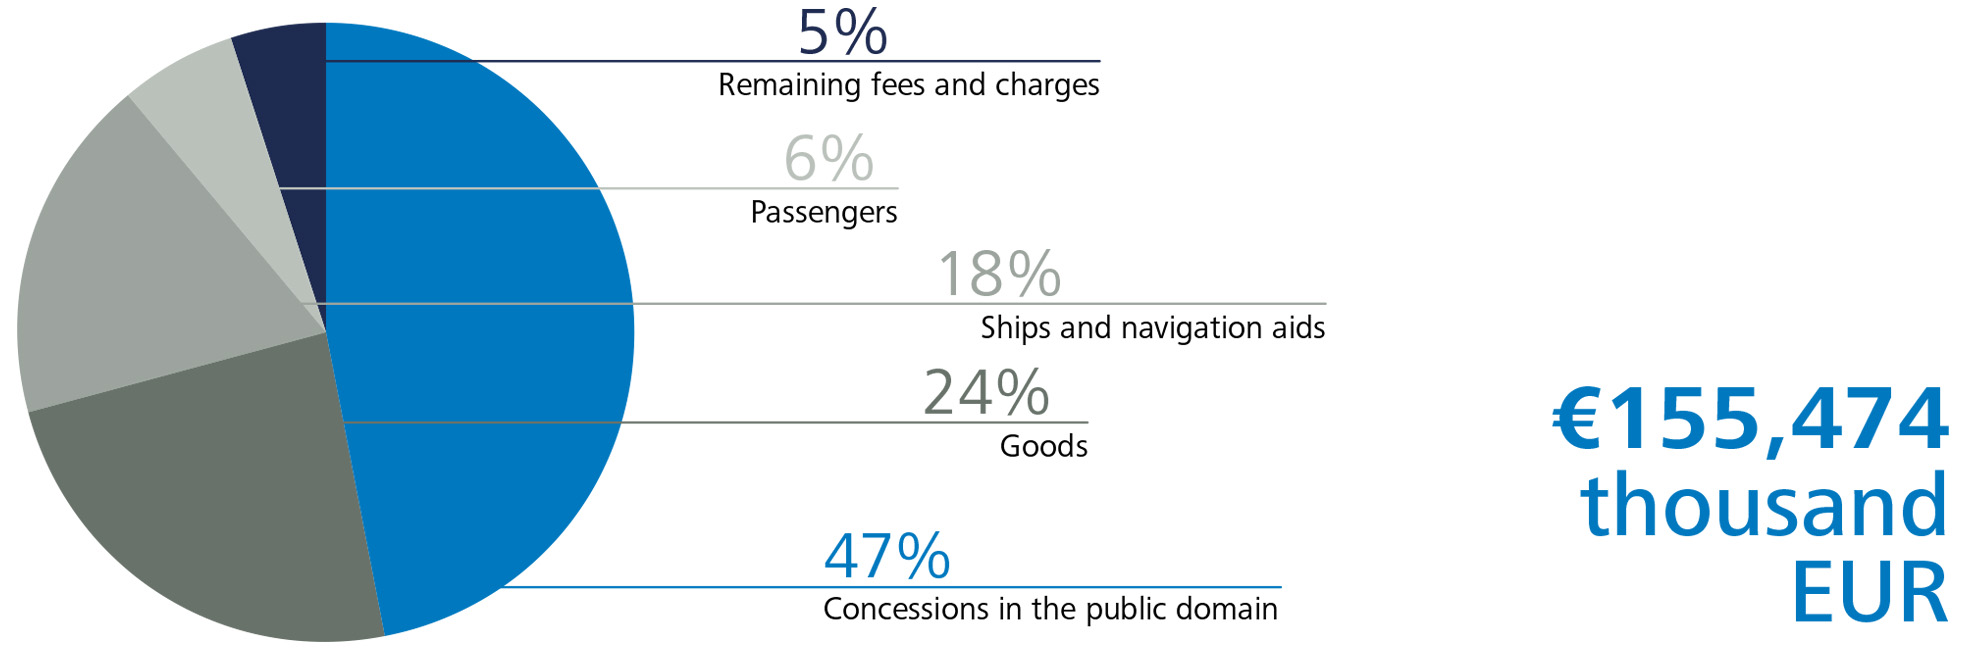
| Fees and other | 7,293 | 6,981 | 312 | 4% |
| 155,474 | 155,617 | (143) | 0% |
¹ Approved by the Board in November 2014 and signed by the Ministry of Public Works in the Ministerial Order of December 2015.
NET TURNOVER (BY BUSINESS LINES) (Thousand EUR)
| 2016 | 2015 | Variation | % Var. | |
|---|---|---|---|---|
| Port fees and additional items | 148,181 | 148,636 | (455) | 0% |
| Vessels and navigation aids | 28,594 | 28,190 | 404 | 1% |
| Cargo | 36,565 | 35,180 | 1,385 | 4% |
| Passengers | 9,856 | 9,728 | 128 | 1% |
| Fresh fish | 180 | 190 | 128 | 1% |
| Pleasure craft | 441 | 390 | 51 | 13% |
| Concessions in the public domain | 72,265 | 74,715 | (3,450) | -3% |
| Other fees for use of the public domain | 71 | 84 | (13) | -15% |
| Fees for special use of the transit area | 209 | 159 | 50 | 31% |
| Charges for commercial services | 7,293 | 6,981 | 312 | 4% |
| 155,474 | 155,617 | (143) | 0% |
2/10
NET TURNOVER - 2016
PROGRESSION OF TURNOVER AND TRAFFIC VOLUME
3/10
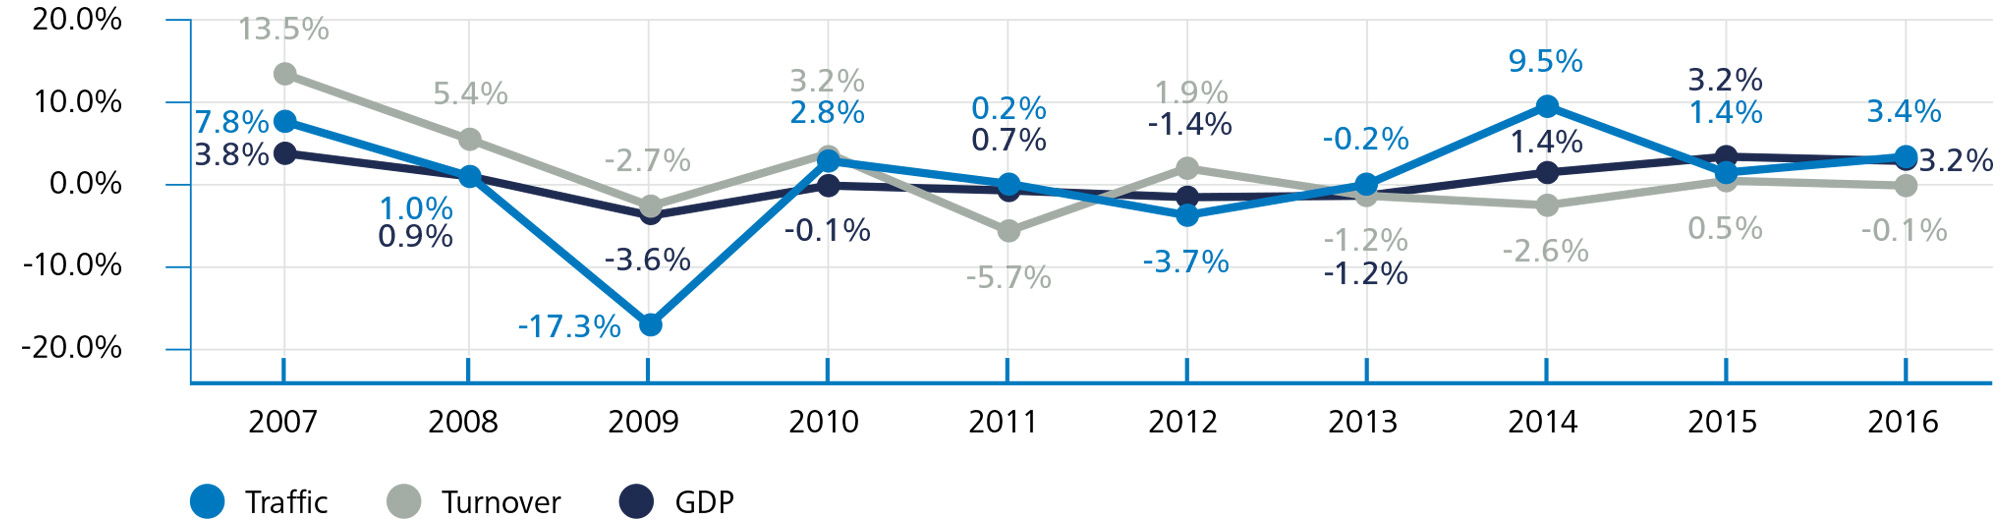
PROGRESSION OF INTERANNUAL TRAFFIC VARIATIONS AND INCOME VS GDP
Operating income stood at € 33.9 million, down 8% year on year. This decrease occurred as a result of the considerable increase in other operating expenses due on the one hand to allocations to provisions for taxes and disputes and on the other to actions performed within the scope of the agreement with the Fishermen's Guild to build the new ice factory.
Losses, caused by tangible assets removed, increased 48% year on year, mainly due to removal of the paint warehouse that was returned to the small vessels repair area.
However, under current expenditure, the volume of personnel costs was the same as in 2015.
The gain recorded under other operating income was due to two new lease contracts and the transfer to results of deferred income from the concessions returned.
OPERATING PROFIT (Thousand EUR)
| 2016 | 2015 | Variation | % Var. | |
|---|---|---|---|---|
| Net turnover | 155,474 | 155,616 | (142) | 0% |
| Other operating income | 5,389 | 3,545 | 1,844 | 52% |
| Staff costs | (31,000) | (31,000) | (110) | 0% |
| Other operating expenses | (43,923) | (39,828) | (4,095) | 10% |
| Depreciations of fixed assets | (55,720) | (53,919) | (1,801) | 3% |
| Allocation of subsidies and other non-financial assets | 6,900 | 6,891 | 9 | 0% |
| Surplus provisions | - | 818 | 9 | 0% |
| Impairment and gains on disposals of assets | (3,344) | (2,256) | (1,088) | 48% |
| Other results | - | (2,938) | 2,938 | |
| Total | 33,886 | 36,929 | (3,043) | -8% |
4/10
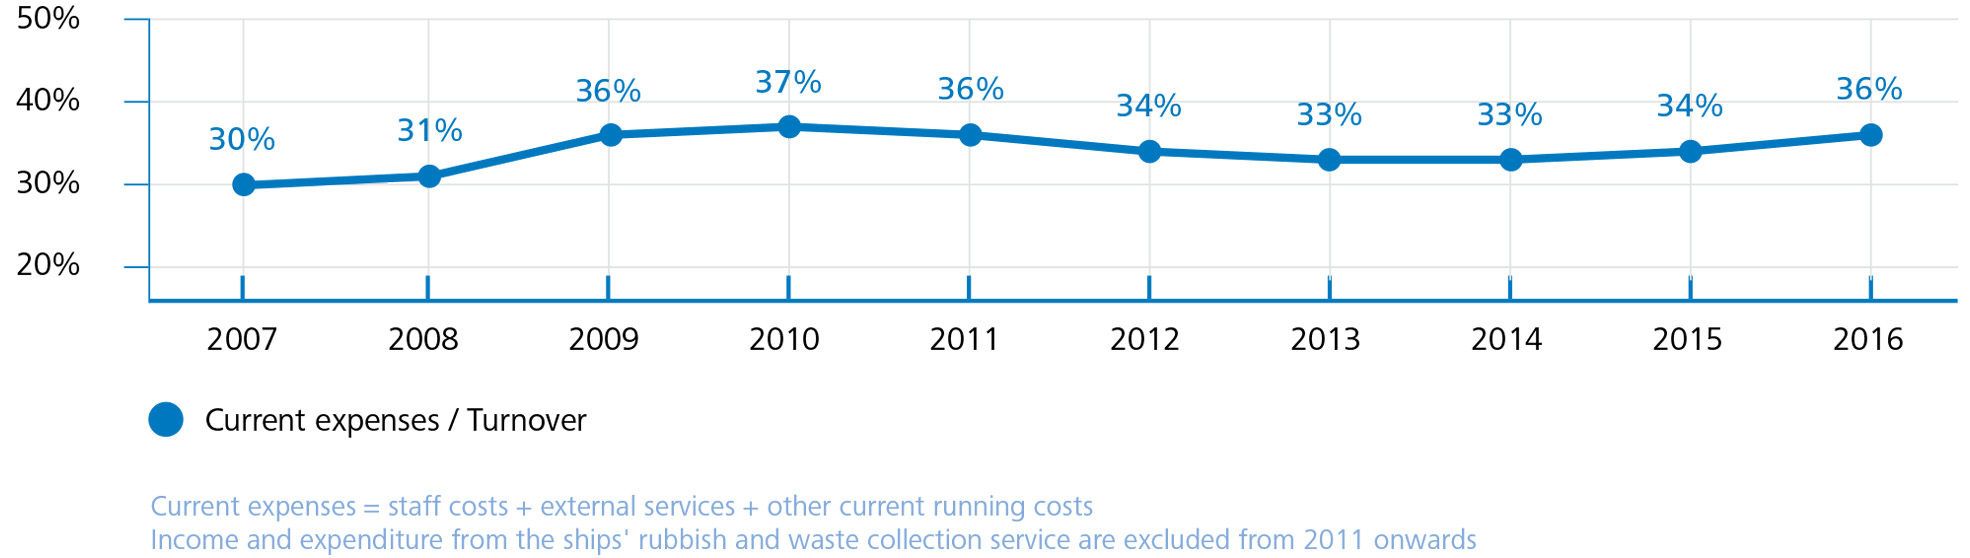
The increase in other current operating expenses pushed up the income absorption ratio by two points compared to the previous year.
INCOME ABSORPTION RATIO
In the field of investments, the most significant transaction of the year was the reduction in the share - totalling € 1.6 million - in the capital of several stakeholder companies.
At the close of the financial year, the percentage of the share capital of stakeholder companies was unchanged compared to the previous year.
STAKEHOLDER COMPANIES (at 31/12/2016)
| % of share capital | |
|---|---|
| Group companies | |
| Gerència Urbanística Port 2000 | 100.00% |
| Centre Intermodal de Logística, SA | 63.00% |
| World Trade Center Barcelona, SA | 52.27% |
| Associated companies | |
| Catalana d'Infraestructures Portuàries, SL | 49.00% |
| Terminal Intermodal Marítima Centro, SL | 49.00% |
| Terminal Intermodal de l'Empordà, SL | 47.32% |
| Puerto Seco de Azuqueca de Henares, SA | 36.73% |
| Portic Barcelona, SA | 40.69% |
| Terminal Marítima de Zaragoza, SL | 21.55% |
| Other stakeholdings | |
| Barcelona Regional Agència Metropolitana de Desenvolupament Urbanístic i d'Infraestructures, SA | 11.76% |
| Puerto Seco de Madrid, SA | 10.20% |
| Perpignan Saint Charles Conteneur Terminal, SAEML | 5.00% |
5/10
The financial result for the year showed a loss of € 0.5 million and a net decline of € 2.9 million compared with profit of € 2.4 million the previous year. This change was the result of the combined effect of:
• The organisation withdrawing from the capital structure of the company Consorci de Parcs Logístics and the sale of the stake in Marina Barcelona 92 represented a joint profit of € 10.7 million in 2015. Adding this year's impairment of € 1.6 million, the net slide in the result in this chapter stood at € 12.3 million.
• On the positive side, we would point to the significant year-on-year reduction in the volume of financial expenses, caused by:
• Early repayment of the loan with the European Investment Bank (EIB Tranche III A) amounting to € 47.5 million, at the end of last year, for which the company was paying a fixed interest rate of 3.748%.
• The progressive reduction in variable interest rates applied to the EIB loans, which from were 0% the second quarter of 2016.
• Early repayment of the loan with the European Investment Bank (EIB Tranche II B) amounting to € 20.8 million at the end of financial year 2016, which involved no additional financial expense in respect of the € 6.6 million paid in 2015 as future interest in the early cancellation performed last year.
• Entering the € 1.5 million due in interest for disputes concerning T3 as financial expenses for FY 2015, which represented a net decrease.
FINANCIAL RESULTS (Thousand EUR)
| 2016 | 2015 | Variation | % Var. | |
|---|---|---|---|---|
| Financial income | 5,112 | 5,303 | (191) | -4% |
| Financial expenses | (5,326) | (15,410) | 10,084 | -65% |
| Change in fair value of financial instruments | 1,276 | 1,819 | (543) | -30% |
| Impairment and gains on disposals of financial instruments | (1,559) | 10,719 | (12,278) | - |
| Total | (497) | 2,431 | (2,928) | - |
6/10
Earnings before interest, taxes, depreciation and amortisation (EBITDA) totalled € 93.9 million and funds from operations generated operating cash flow of € 86.3 million, an increase of 17.1% compared to the € 73.7 million the previous year.
EBITDA (Thousand EUR)
| 2016 | 2015 | Variation | % Var. | |
|---|---|---|---|---|
| Operating profit | 73,553 | 66,101 | 7,452 | |
| Plus | 33,886 | 36,929 | (3,043) | -8% |
| Funding Puertos del Estado | 5,744 | 5,715 | 29 | |
| Net contribution to the Interport Compensation Fund | 4,035 | 3,978 | 57 | |
| Depreciation of fixed assets | 55,720 | 53,919 | 1,801 | |
| Reserves for liabilities and expenses | 3,920 | - | 3,920 | |
| Losses from fixed assets | 4,109 | 2,467 | 1,642 | |
| Other | 25 | 22 | 3 | |
| Minus | 13,578 | 13,183 | 395 | |
| Profits accruing from fixed assets | 576 | 3 | 573 | |
| Valuation adjustments for impairment of non-current assets | 190 | 208 | (18) | |
| Surplus provisions for liabilities and expenses | - | 818 | (818) | |
| Capital grants and others transferred to profit | 6,900 | 6,891 | 9 | |
| Income from return of concessions | 1,608 | 995 | 613 | |
| Entering advances received for services rendered in results | 4,304 | 4,268 | 36 | |
| Total | 93,861 | 89,847 | 4,014 | 4% |
7/10
FUNDS GENERATED AND FINANCING CAPACITY (Thousand EUR)
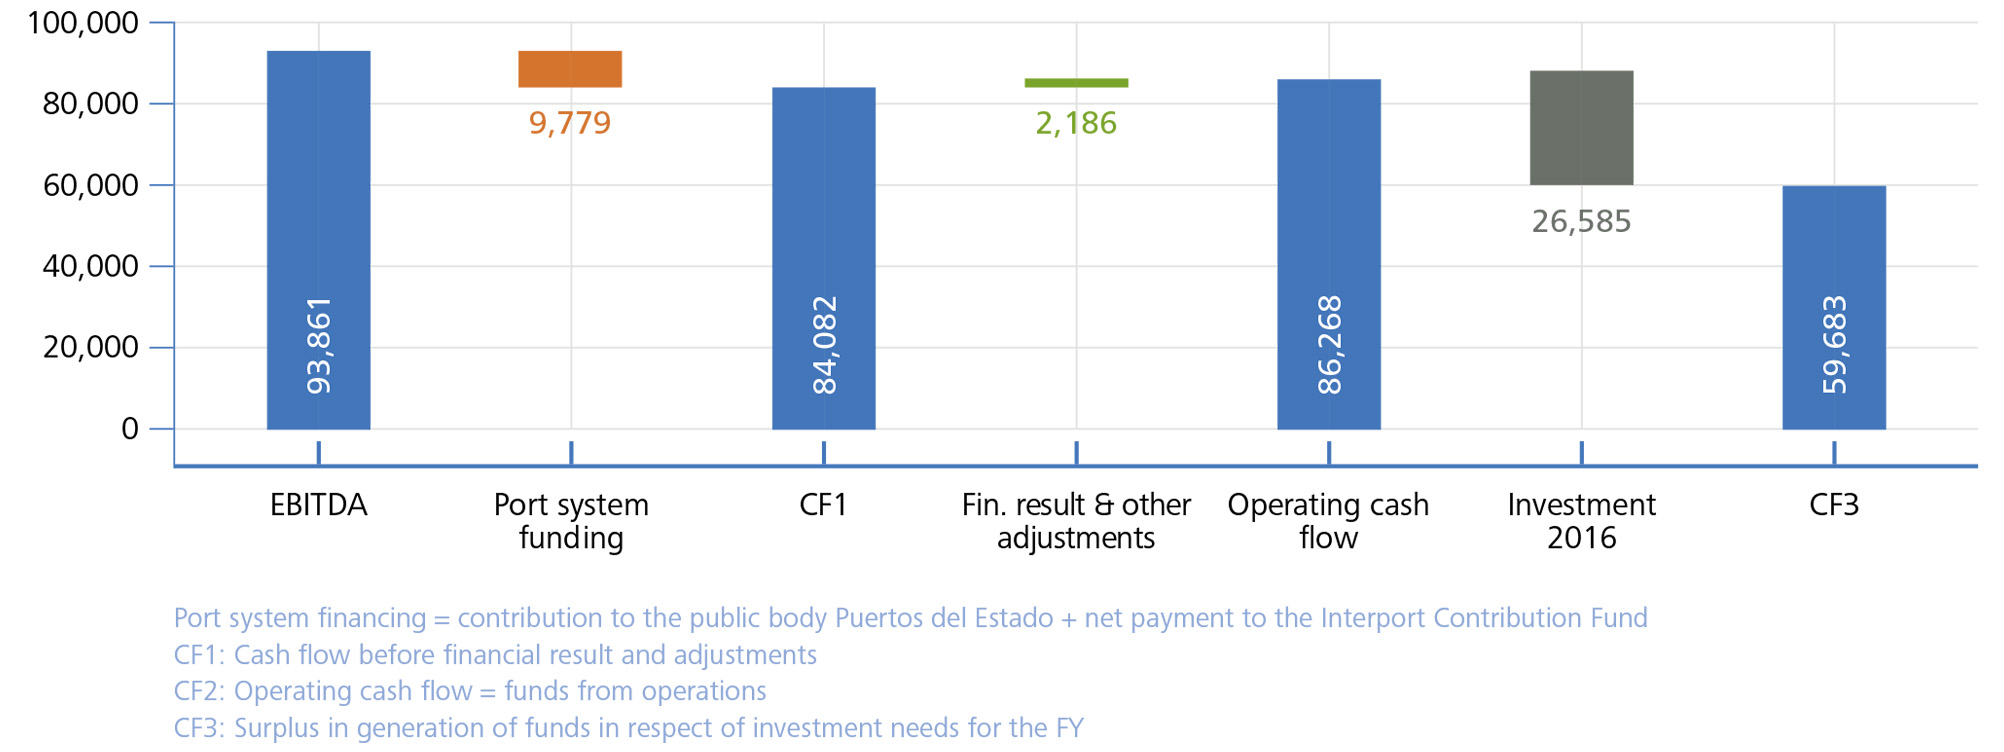
Total investments performed stood at € 26.6 million, down 60% year on year, resulting in a surplus of € 59.7 million in relation to resources generated by operations.
Without affecting the investment budget, the organisation's equity and assets increased € 26.7 million as a result of approving a substantial change in the Delimitation of Port Areas and Uses (DEUP). In line with this plan, the Port of Barcelona has extended its land by taking on ownership of the former Llobregat riverbed.
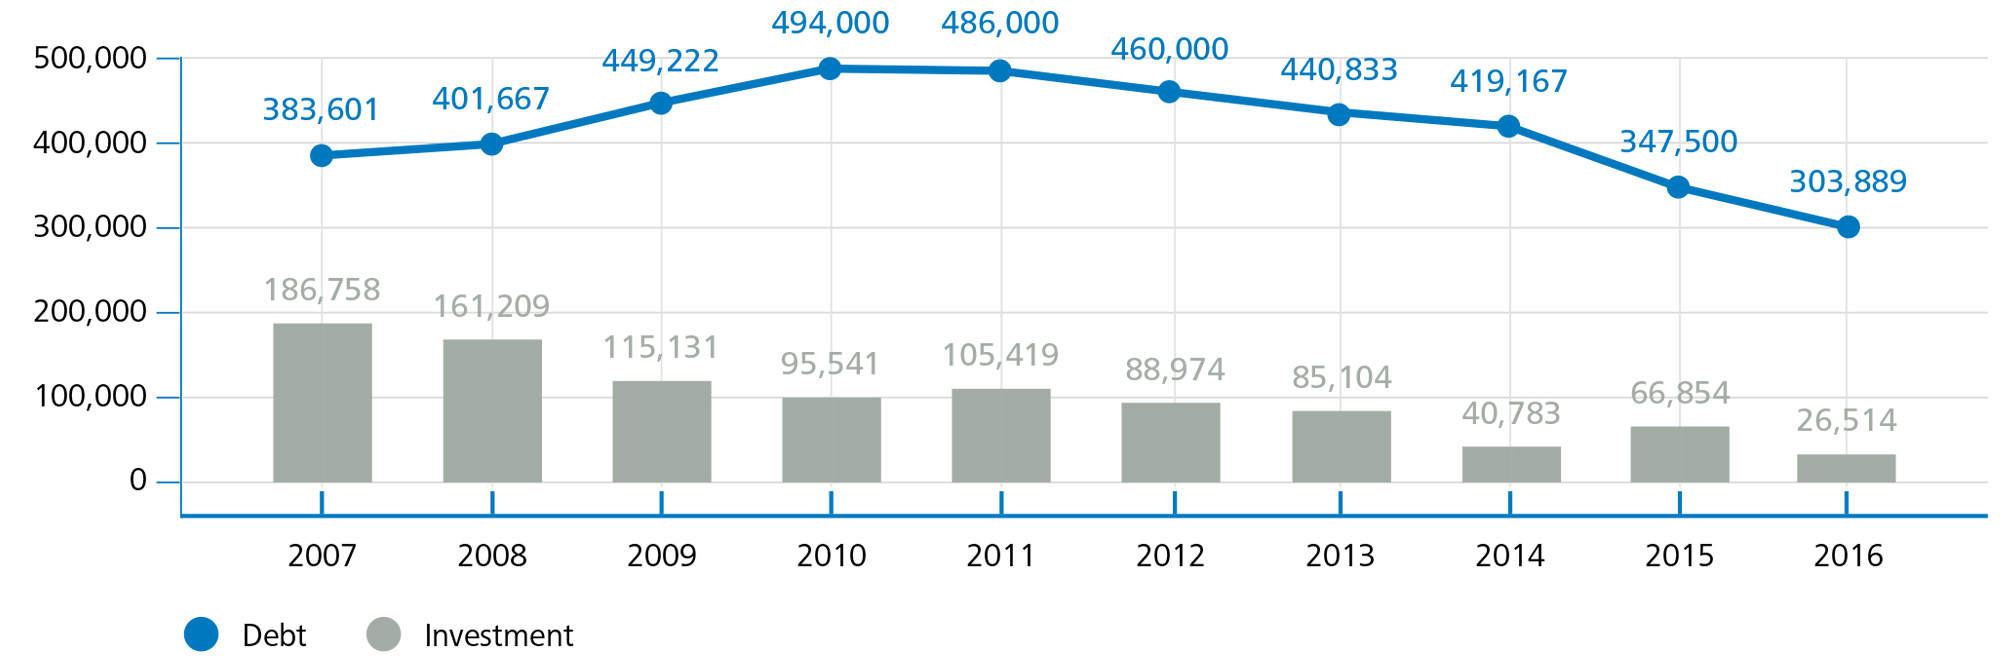
For the second year in a row, a loan that the company took out with the European Investment Bank was paid back early. This year the total concerned was € 20.8 million; last year it was € 47.5 million.
In addition to the loan repayment, account should be taken of the transfer of € 22.8 million to short-term debt, therefore long-term bank debt stood at € 303.9 million at the close of the financial year, the lowest figure for the last ten years.
² Amendment published by Order FOM/1684/2016 of 20 October 2016 (BOE. 257 of 24 October 2016)
8/10
PROGRESSION OF ANNUAL INVESTMENT AND LONG-TERM BANK DEBT (Thousand EUR)
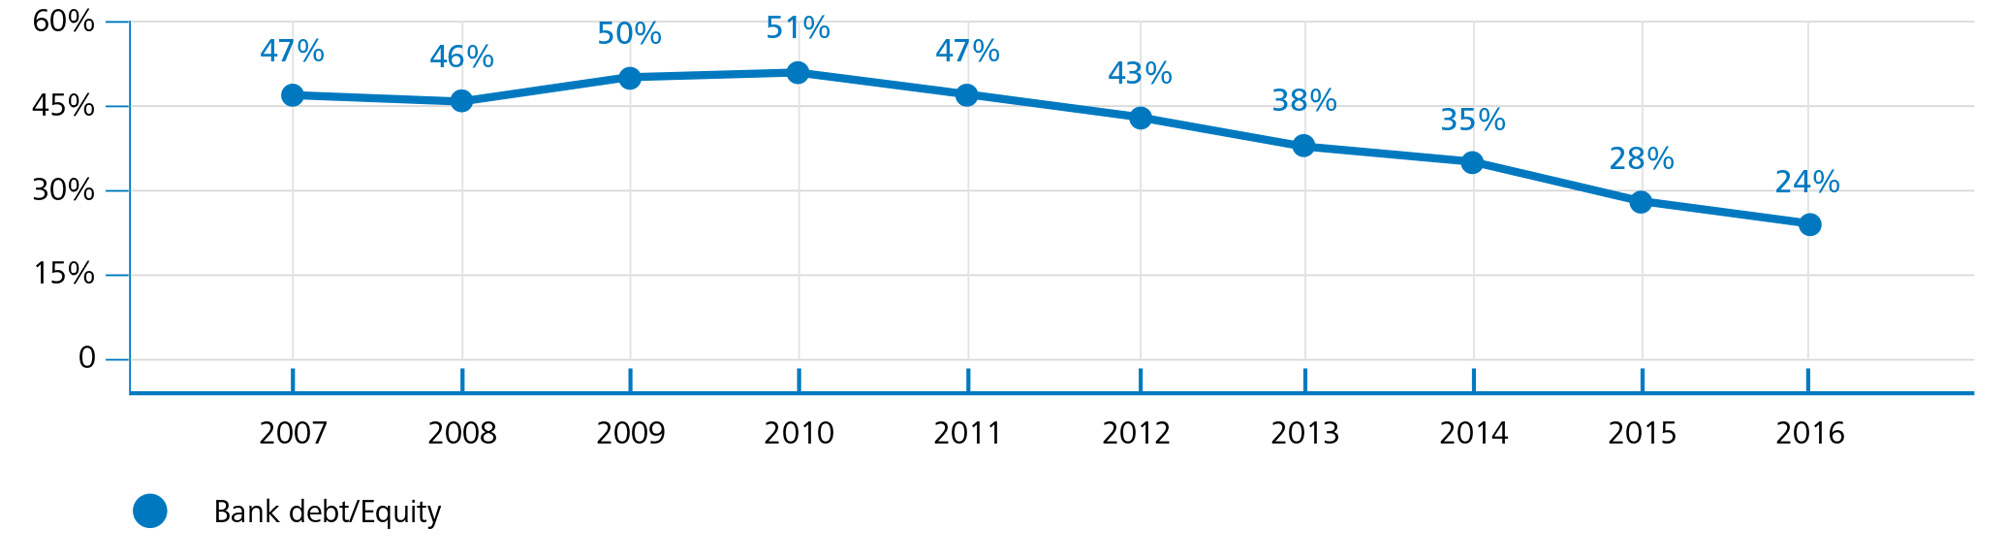
The progressive reduction in the volume of debt, combined with the inclusion of the financial results in equity, placed the debt ratio at 24%.
PROGRESSION OF THE DEBT RATE
9/10
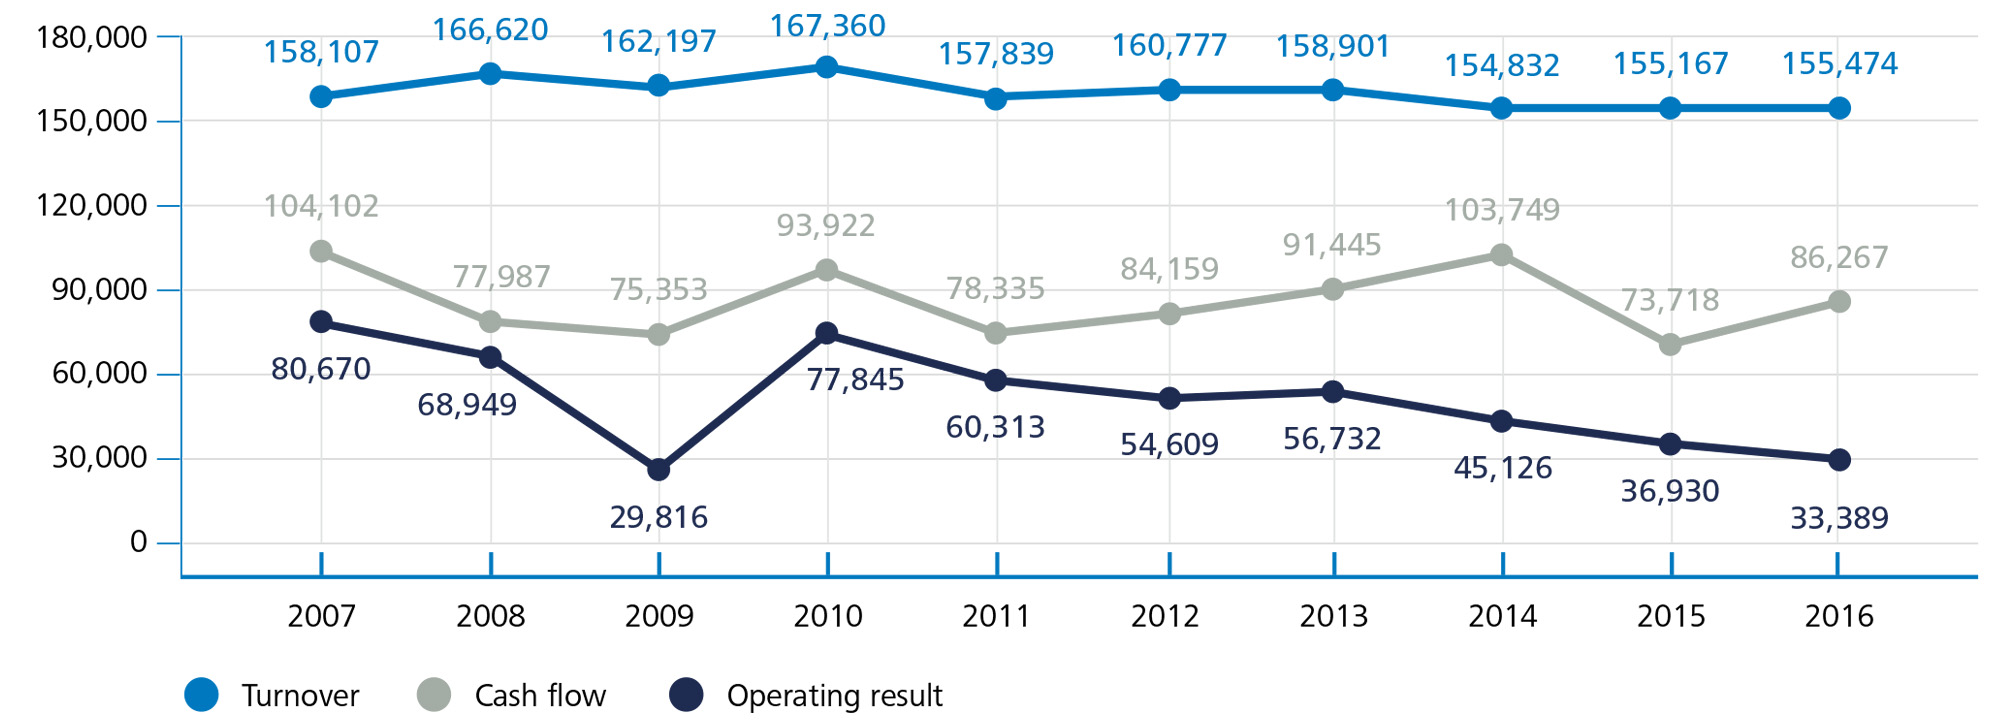
PROGRESSION OF MAIN ECONOMIC INDICATORS (Thousand EUR)
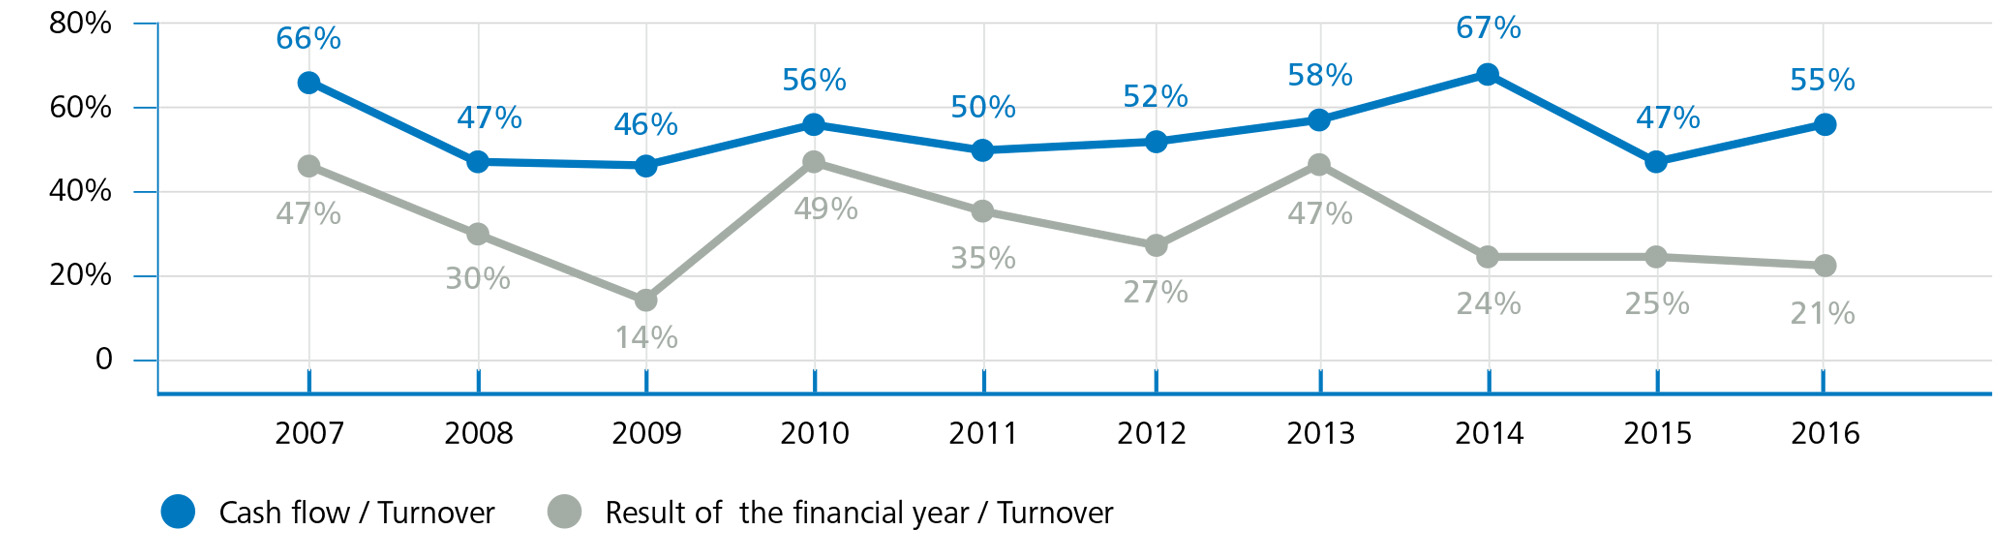
RATIOS OF MAIN ECONOMIC INDICATORS
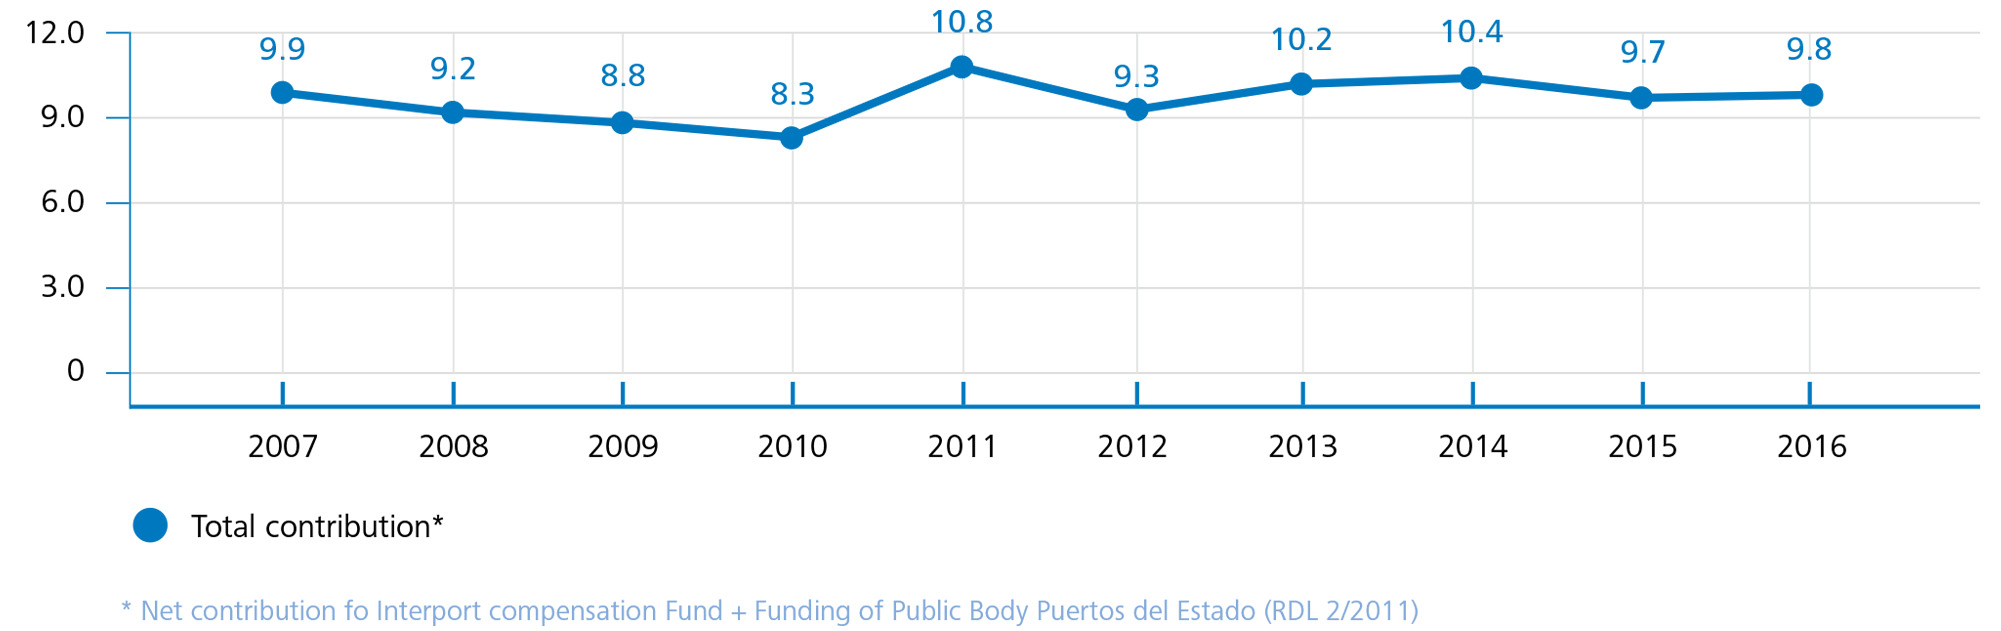
BARCELONA PORT AUTHORITY CONTRIBUTIONS TO STATE PORT SYSTEM (Million EUR)